
Service 03
Yardi Data Connect & Power BI
Turn Yardi Data Into Business Insight.
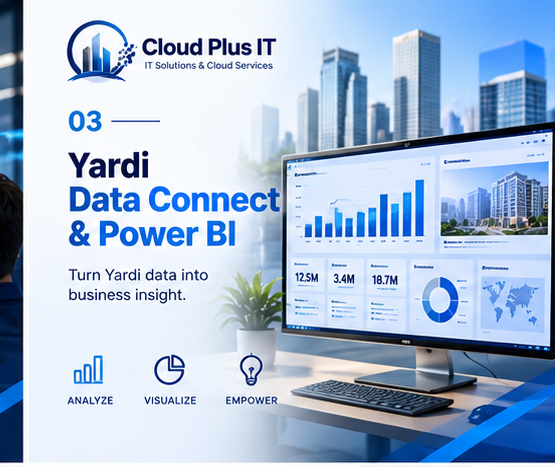
Cloud Plus IT helps organizations transform Yardi-related data into structured reporting, dashboards and business intelligence that support better operational and management decisions. From data integration and modelling to Power BI dashboards and management reporting, we focus on making information easier to understand, validate and use.
Your data should help answer business questions
Having data is not the same as having insight. Operational and financial information may be distributed across Yardi, reports, spreadsheets and other business systems, making it difficult to build a consistent view of performance. We start with the questions decision-makers need answered, then assess what information is available and how it should be prepared.
What we can help with
Yardi Data Integration
Assess appropriate, authorized methods of bringing Yardi-related data into a reporting environment.
Power BI Dashboards
Create clear dashboards shaped around agreed measures, audiences and decisions.
Data Modelling
Structure and relate datasets so definitions and calculations are consistent.
Management Reporting
Present relevant operational and financial views for management review.
Operational Analytics
Explore trends, exceptions and patterns that help teams identify areas needing attention.
Data Validation
Compare outputs with source information and document known limitations or discrepancies.
Existing Reporting Review
Evaluate reports and dashboards for accuracy, clarity, duplication and usefulness.
Our approach
Define the questions Identify decisions, audiences and measures.
Identify the data Review available sources, access and data quality.
Structure & model Establish definitions, relationships and calculations.
Build the reporting layer Develop reports and dashboards appropriate to the users.
Validate Reconcile representative outputs with agreed source records.
Improve Refine based on feedback and changing reporting priorities.
Dashboards with a purpose
A dashboard should not display charts simply because data exists. Each view should answer a useful question, show appropriate context and help users decide what to investigate next. Depending on the available data, reporting might cover portfolio visibility, leasing activity, operational performance, financial analysis, trends and exceptions.
Reporting that people can trust
Clear definitions, access controls and validation matter as much as visual presentation. We make assumptions and data limitations visible rather than presenting uncertain information as established fact.
Related Yardi services
Need clearer visibility from your Yardi data?
Tell us what your teams need to understand and the decisions the information needs to support.